Story · Field atlas · No 04

The short version, in seven cards

parallaxlens.com/s/2026-05-03-el-nino-new-floor
Parallax · Story 1 / 7
Parallax medallion, earth desk
Field atlas · No 04

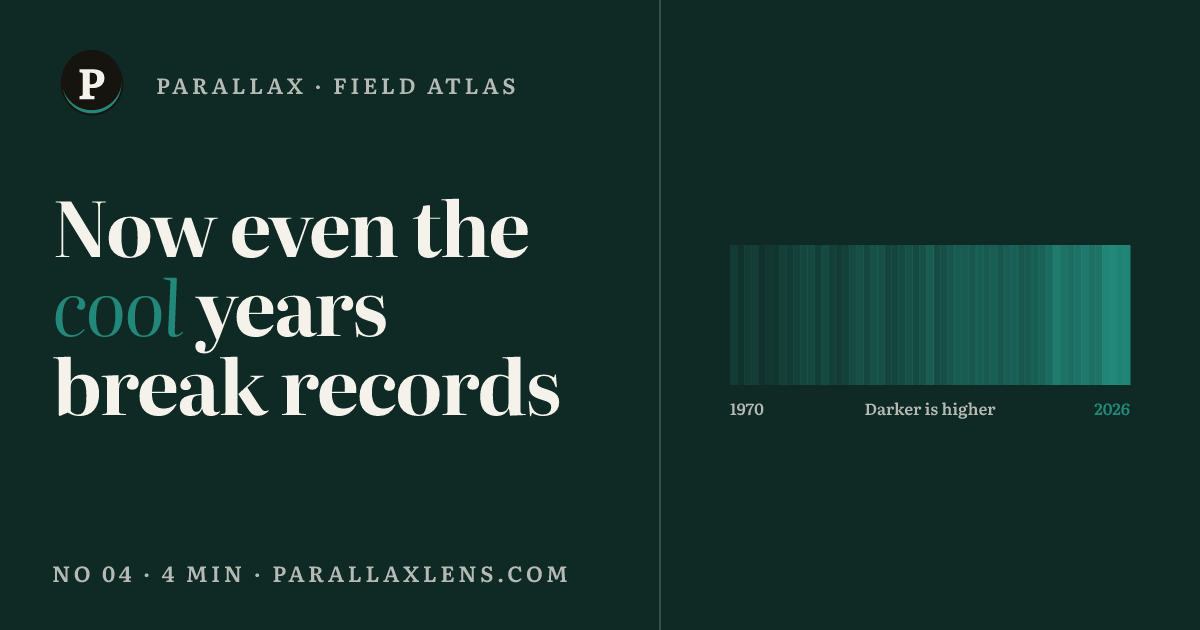
Now even the cool years break records

You have lived through the eleven hottest years ever recorded. The last of them, 2025, was supposed to be a cool one.

3 May 2026 · 4 min read · 15 sources
Swipe up Swipe
Field atlas · No 04 2 / 7
The cool year won

The cool year won.

What most people think

El Niño heats the world for a year, La Niña cools it back, and the two cancel out. Like a swing.

What the data shows

1.44°C

2025 was meant to be the cool year. The Pacific was in its La Niña phase, the phase that pulls the world's temperature down. It still finished second-hottest ever recorded.

Source · Carbon Brief State of the Climate 2025

Field atlas · No 04 3 / 7
Fifty-seven years

Fifty-seven years, one stripe each.

+1.55 °C in 2024

The old record: 2016's El Niño peak.

A La Niña year, and still above the 2016 peak.

1970: +0.16 °C 1971: +0.01 °C 1972: +0.2 °C 1973: +0.21 °C 1974: +0.01 °C 1975: +0.08 °C 1976: +0.05 °C 1977: +0.25 °C 1978: +0.16 °C 1979: +0.27 °C 1980: +0.36 °C 1981: +0.4 °C 1982: +0.23 °C 1983: +0.41 °C 1984: +0.24 °C 1985: +0.2 °C 1986: +0.27 °C 1987: +0.43 °C 1988: +0.49 °C 1989: +0.37 °C 1990: +0.55 °C 1991: +0.5 °C 1992: +0.32 °C 1993: +0.34 °C 1994: +0.42 °C 1995: +0.54 °C 1996: +0.44 °C 1997: +0.55 °C 1998: +0.74 °C 1999: +0.48 °C 2000: +0.51 °C 2001: +0.63 °C 2002: +0.72 °C 2003: +0.72 °C 2004: +0.65 °C 2005: +0.77 °C 2006: +0.71 °C 2007: +0.76 °C 2008: +0.64 °C 2009: +0.74 °C 2010: +0.81 °C 2011: +0.65 °C 2012: +0.69 °C 2013: +0.78 °C 2014: +0.84 °C 2015: +1.01 °C 2016: +1.29 °C 2017: +1.13 °C 2018: +1.03 °C 2019: +1.13 °C 2020: +1.25 °C 2021: +1.1 °C 2022: +1.15 °C 2023: +1.47 °C 2024: +1.55 °C 2025: +1.44 °C 2026: +1.47 °C
+0.01 °C +1.55 °C Against 1850–1900 pre-industrial average

Fifty-seven years, one stripe a year. The last dozen stripes are hotter than every stripe before them, and that dozen includes the cool La Niña years.

Source · Berkeley Earth · Copernicus C3S ERA5 · WMO State of Global Climate 2025 · Carbon Brief (2026 = projected best estimate)

Field atlas · No 04 4 / 7
Where the heat goes

Of every hundred units, the sea keeps 91.

The ocean's share of Earth's extra heat

91%

The air you feel holds one part in a hundred. The sea holds the rest.

  • 91 units of every 100 the planet traps, held in the sea Land holds five parts, ice three, the air one.

  • In 2025 alone the sea gained 39 years of human energy use The ocean's record heat gain that year.

Of every 100 units of extra heat the planet traps, 91 go into the sea. About one part in a hundred stays in the air you feel. The sea does not hand it back.

Source · WMO State of Global Climate 2025

Field atlas · No 04 5 / 7
The two cool years

Two cool years, one direction.

2022 · La Niña year
1.1–1.3 °C
2024 · El Niño peak
1.55 °C
2025 · La Niña year
1.44 °C
How much La Niña cooled 2025
−0.05 °C

Two cool years, three years apart: the first ranked fifth or sixth warmest, the second tied second-warmest ever. The cooling happened both times, but the floor moved anyway.

Source · Carbon Brief State of the Climate 2022 / 2024 / 2025 · WMO State of Global Climate 2025

Field atlas · No 04 6 / 7
What comes next

A super El Niño, then the lag.

Probability El Niño develops
61 %
How warm the central Pacific gets · September
+2.2 °C
2026 = 2nd warmest year
62 %
2026 exceeds 1.5°C
~30 %

Forecasters give this El Niño 61% odds and see the Pacific peaking in September. The world's record follows about three months later, which puts it in 2027.

Source · NOAA Climate Prediction Center · Carbon Brief Q1 2026 State of Climate · WMO Likelihood Increases of El Niño
Field atlas · No 04 7 / 7
The whole issue

Read the full issue: where the extra heat goes, and why the next cool year starts higher.

9 sections
15 sources, linked
4 minutes
Still in the issue
  • Vocabulary
  • Floor rises
  • It happened
  • Year after
Read the whole issue
Share